After last week’s catch up week we are back with things 19 and 20 and it is all about Publishing. In today’s online world you don’t have to be an artist to create great online materials.
We are introducing you to Issuu, Smore and in the cool extra thing a great way of producing infographics using Easel.ly.
Issuu is an online digital publishing platform that allows for amazing presentation of all types of material including newsletters, magazines, catalogs, or similar publications.
“Issuus” look like a magazine or book–color photos or illustrations, layouts as you want them, pages that turn digitally.
They are quick to create, you just need a PDF and you can share them, embed them and email them easily. There are advanced options including adding audio. Issuu allows you to use your own logos, choose colors, and include icons. The process is guided and simple. Once complete, your finished product can function as a book, complete with pages that need to be turned.
This video gives you an idea of what it is:
In 2009, TIME magazine included Issuu as one of the 50 best websites of the year. “Maybe a gadget like Amazon’s Kindle can compete with the old-fashioned ink-on-paper experience, but for our money – which in this instance, is zero dollars – we’ll take Issuu, an online newsstand with infinite shelf space, hundreds of interesting micro – publishing projects and a slick online reader.”
Here are some other library examples
City University Library put all marketing and training documentation online and embedded in the library website.
You can also search the issuu library and find interesting and useful information, search for Royal Holloway and see who else is using it.
Thing 19
Have a look at how the links above use Issuu. Do you think it is a useful method of publishing? You can blog about this but if you want to publish something you can use PDFs, Word Documents, Powerpoints and Rich Text Formatted files.
Publishing on Issuu
You will need to register but if it is for the library you can login with the library’s account (ask any of the team for this) to upload items.
Once you’re logged in, click the blue ‘Upload document’ button.
Select the document file and fill out the required details
Click ‘Upload’ and let the file upload completely.
We will now automatically convert your uploaded file to a nice Issuu publication.
Once the conversion has completed you can find your uploads in My Library.
You can upload most common document files, including PDF, DOC, PPT, RTF, WPD, ODT and more. Documents must be less than 500 pages and 100 mb.
Smore allows you to create appealing online flyers, quickly and easily. To get started visit http://www.smore.com and sign in using your Facebook account or sign up for an account. Once you’ve signed-up/logged-in, click on the big red ‘Start a new flyer’ button at the top of the page to get started. You’re then presented with a options that help create a template for your flyer. Select these and you’ll be taken to the WYSIWG editor, which allows you to customise your flyer. To get a feel for this, watch the following video:
There are a few different things you can customise, so have a play around and see what you can do!
Once you’ve created your flyer, you’ll be able to publish it and share it with others, and well as collecting lots of useful statistics about who’s viewing it.
This weeks Cool Extra Thing is easel.ly, A tool which allows you to create and share visual ideas online. You will need to login to use easel.ly – in fact I recommend you do this before you do anything else, I designed a whole graphic and then the system crashed… Once you have logged in you can use easel.ly to represent data in a graphic form. There are a number of templates you can alter or alternatively you can have a go at designed an infographic from scratch.
I designed an infographic to show what devices and browsers are used to access the RHUL Library website (information I got from our google analytics account).
While this infographic is nice in the way it presents the data in a graphic form it does show the big challenge in this area – you have to invest time in working out what data you are going to display and how you are going to display it, because otherwise there is a risk that the infographic is not actually adding anything useful.
When done well the power of displaying information in a visual form is immense. A particularly good example of this is the BBC infographic which visualises the internet – http://news.bbc.co.uk/1/hi/technology/8562801.stm . This is a few years out of date now but it still is interesting – the graphic representation of the domination of US sites is particularly striking.
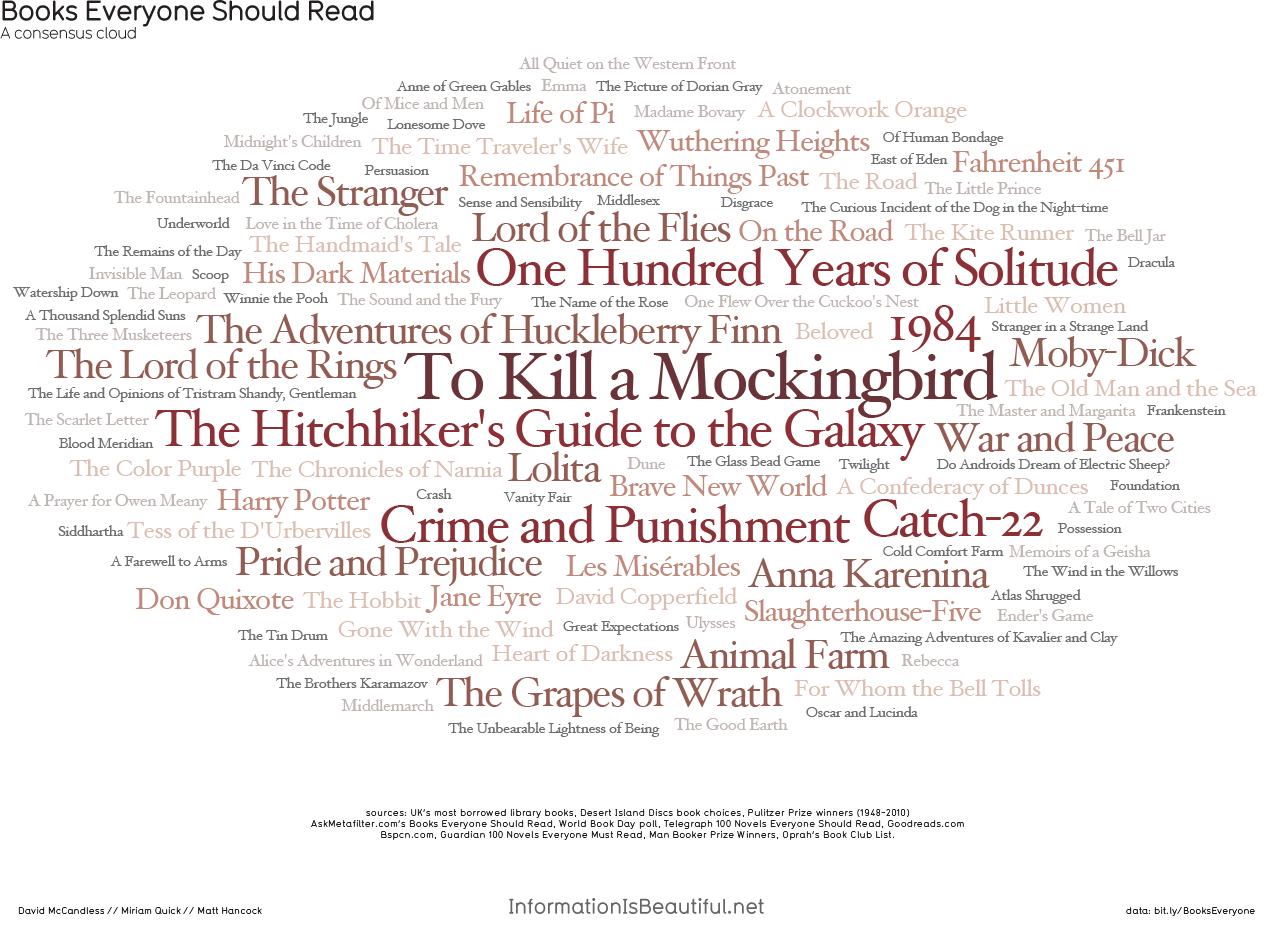
The Information is Beautiful site has some lovely graphic representations. One Library related one is the Books Everyone Should Read. This includes the UKs most borrowed library books, and the books people would take with them from desert island disks
On a slightly less beautiful theme the Guardian has mapped the European Trade in Horsemeat – also an interesting graphic!
I hope you enjoy exploring the possibilities of data visualisation.